There was an annual increase in employment of 3.7% or 81,200 in the year to the first quarter of 2019, bringing total employment to 2,301,900. This compares with an annual increase of 2.3% or 50,500 in employment in the previous quarter and an increase of 2.9% or 62,400 in the year to Q1 2018.
Summary points for Q1 2019
The increase in total employment of 81,200 in the year to Q1 2019 was represented by an increase in full-time employment of 62,600 (+3.5%) and an increase in part-time employment of 18,600 (+4.1%).
On a seasonally adjusted basis, employment increased by 35,200 (+1.5%) over the previous quarter. This follows on from a seasonally adjusted increase in employment of 18,400 (+0.8%) in Q4 2018, an increase of 10,900 (+0.5%) in Q3 2018, an increase of 15,400 (+0.7%) in Q2 2018 and an increase of 7,400 (+0.3%) in Q1 2018.
Unemployment decreased by 18,600 (-14.0%) in the year to Q1 2019 bringing the total number of persons unemployed to 114,400. This is the twenty seventh quarter in succession where unemployment has declined on an annual basis.
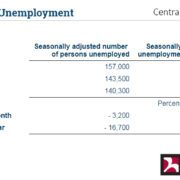
The seasonally adjusted unemployment rate decreased from 5.6% in Q4 2018 to 5.0% in Q1 2019, while the seasonally adjusted number of persons unemployed decreased by 14,300 to 120,300.
The long-term unemployment rate decreased from 2.1% to 1.7% over the year to Q1 2019. Long-term unemployment accounted for 35.7% of total unemployment in Q1 2019.
The total number of persons in the labour force in the first quarter of 2019 was 2,416,300, representing an increase of 62,600 (+2.7%) over the year. This compares with an annual labour force increase of 31,900 (+1.4%) in Q1 2018. The number of persons not in the labour force in Q1 2019 was 1,480,200, an increase of 9,900 (+0.7%) over the year.
Employment
The annual increase of 81,200 (+3.7%) in employment was represented by an increase of 30,800 (+2.5%) in male employment and an increase of 50,400 (+5.0%) in female employment over the year.
Employment increased in 12 of the 14 economic sectors over the year (excluding Not stated). The largest rates of increase were recorded in the Transportation and storage (+11.4% or +10,800) and the Administrative and support service activities (+10.6% or 10,500) sectors.
The overall employment rate among persons aged 15-64 was 69.3% in Q1 2019 compared to 67.9% in Q1 2018.
The number of employees in Q1 2019 was 1,966,800, up 99,300 (+5.3%) over the year. The number of self-employed persons decreased by 14,500 (-4.3%) over the year to 323,900.
Unemployment
Male unemployment decreased by 7,800 (-10.6%) to 65,900 over the year to Q1 2019, while female unemployment decreased by 10,700 (-18.1%) to 48,400 over the same period.
The overall unadjusted unemployment rate decreased from 5.7% to 4.8% over the year to Q1 2019.
In the year to Q1 2019, the number of persons classified as long-term unemployed decreased by 9,300 (-18.5%), bringing total long-term unemployment to 40,900. Short-term unemployment decreased by 9,500 (-11.9%) over the year to 70,300.
The unemployment rate for 15-24 year olds (youth unemployment rate) decreased from 12.5% to 10.9% over the year to Q1 2019.
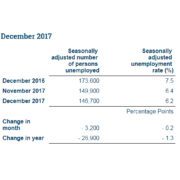
A series of Monthly Unemployment statistics was first issued by the CSO in 2015. The most recent publication was issued in May 2019 for reference month April 2019. The Monthly Unemployment release contains a series of monthly unemployment rates and volumes. These series are based primarily on the LFS and are compiled in accordance with agreed international practice. Data for more recent periods for which no LFS benchmark is available is adjusted for trends in the Live Register. These statistics are the definitive measure of Monthly Unemployment and replaced the SUR (which has been discontinued).
The previously published seasonally adjusted monthly unemployment figures are now revised with the availability of new LFS benchmark unemployment estimates for Q1 2019. The seasonally adjusted monthly unemployment rate for March 2019 is now revised from 5.4% to 4.7%, while the seasonally adjusted number of persons unemployed is revised from 131,400 to 114,400.
The provisional estimate for April 2019 has also been revised with the seasonally adjusted unemployment rate for April 2019 revised from 5.4% to 4.6%, while the seasonally adjusted number of persons unemployed is revised from 129,700 to 112,500.
Labour force
As with employment, the number of persons in the labour force is also influenced by changes in the size of the working age population (demographic effect). Up to the start of 2008 this demographic effect had been adding at least 30,000 to the labour force on an annual basis, primarily driven by net inward migration. This demographic effect peaked at over 90,500 in the second quarter of 2007.
With the decline in inward migration the positive demographic effect started to fall in the second half of 2007 and continued to decline throughout 2008 and 2009 before becoming negative in Q3 2009. The negative demographic effect continued for each quarter until Q1 2014. The demographic effect has been positive since Q2 2014 and in Q1 2019 a positive demographic effect contributed an increase of 36,000 to the overall change in the labour force.
In addition to the demographic effect, the change in the size of the labour force is influenced by changes in participation. While the overall participation rate increased by 0.5 percentage points to 62.0% over the year, the net result of changes in individual age groups for the same period was a positive participation effect of 26,600.
Of those persons not in the labour force, the number classified as being in the potential additional labour force was 108,200 in the first quarter of 2019.
International Comparisons
The employment rate in Ireland increased by 0.8 percentage points to 69.1% over the year to Q4 2018. The employment rate in the EU-28 in Q4 2018 was 68.9%.
The unadjusted unemployment rate among the EU-28 countries in the fourth quarter of 2018 was 6.6%, while the comparable rate in Ireland was 5.4%. The highest unemployment rates among the EU-28 countries in Q4 2018 were recorded in Greece and Spain (18.7% and 14.5% respectively), while the lowest rates of 2.0% and 3.2% were recorded in the Czech Republic and Germany respectively.
The latest figures available at the time of finalising this release indicate that the seasonally adjusted unemployment rate for the EU-28 for March 2019 was 6.4% compared to the revised seasonally adjusted monthly unemployment rate of 4.7% for Ireland for the same period.
CSO Reports