


Address
Hambleden House
19-26 Pembroke Street Lower
Dublin 2
D02 WV96
Ireland
»Map
Contact Us
Phone: +353 (1) 6477900
Fax: +353 (1) 6477901
Email: info@bannon.ie


The dramatic improvement in the balance sheets of Irish Consumers in the last decade is astounding, savings are up 35% and debt is down 33%, a €70bn nett turnaround. The potential for a positive impact on the retail sector post reopening is clear, the question is where will the money be spent. We are modelling the potential impact on the different retail sub-sectors and expect to see a very different outturn to the 2013 recovery.
Joint agents CBRE and Bannon are guiding a price of €2.5 million for lands zoned for the development of retail and residential in the commuter town of Dunboyne, Co Meath.
The subject site extends to 3.54 acres and is located at the centre of the town, to the rear of St Peter and Paul’s church and immediately adjacent to the new SuperValu development. Dunboyne train station is situated 1km from the property. The front section of the site is currently in use as a car park, while the rear section is under grass.
The site is located in an area zoned “B1 town/village centre” under the draft Meath County Development Plan 2020-2026. It is also identified as a “retail opportunity site” OS 1, under which additional retail development for the town could be accommodated. Residential development is also permitted under the current zoning objective.
Dunboyne is a well-established residential location, with an abundance of amenities including sports clubs, shops, cafes and restaurants. There are several schools in the town, including Dunboyne Primary School, Gaelscoil Thulach na nÓg and St Peter’s College secondary school.
There are a number of employment hubs located within close proximity to the town, including Dunboyne Business Park, the IBM campus in Mulhuddart, Blanchardstown and Damastown Industrial Park, MSD and Facebook Clonee.
Dublin city centre is located just 18km from Dunboyne and is readily accessible via the M3 motorway. In terms of public transport, Dunboyne train station offers a regular service to Dublin each day, with a travel time of about 30 minutes to the Dublin Docklands station. There are also in excess of 30 Dublin Bus services per day.
Darragh Deasy of CBRE’s development land division says: “This is a rare opportunity to acquire a development site in one of Meath’s most desirable residential locations. The subject site has terrific development potential, subject to planning permission, and should appeal to a wide pool of purchasers.”
Niall Brereton, director at Bannon, adds: “Dunboyne has been identified as a strategic development area within the Dublin Metropolitan Area Strategic Plan. Given the central location of these lands, they offer undoubted potential to develop a mixed-use scheme, subject to planning permission.”
Are you interested in the history of some of Dublin’s past and present retailers?
Well, the Central Library are hosting a new series by Dublin City Council Historian in Residence Dr Mary Muldowney which takes a look at retail streets like Henry Street and how they have changed over the last 100 years or so. The series features Dublin favourites Arnotts, Clerys, Roches Stores and other major retailers that have disappeared; as well as featuring the small businesses.
In her opening talk on 8 February, Mary introduced us to the history of retail in Dublin City Centre.
The next talk, Shopping in Dublin City Centre 1790-1990. Henry Street and the women who worked there is on 8 March at 7pm.
This lecture will take place on Zoom and, in honour of International Women’s Day on 8th March, it will focus on the women who ran and worked in the many retail businesses on Henry Street.
Bannon is delighted to support the @scsi recently launched Climate & Biodiversity Emergency Declaration. The “Surveyor’s Declare” document is an important resource for Surveyors who have signed up in support of a framework for Surveyors who are committing to play their part in the climate change challenge.
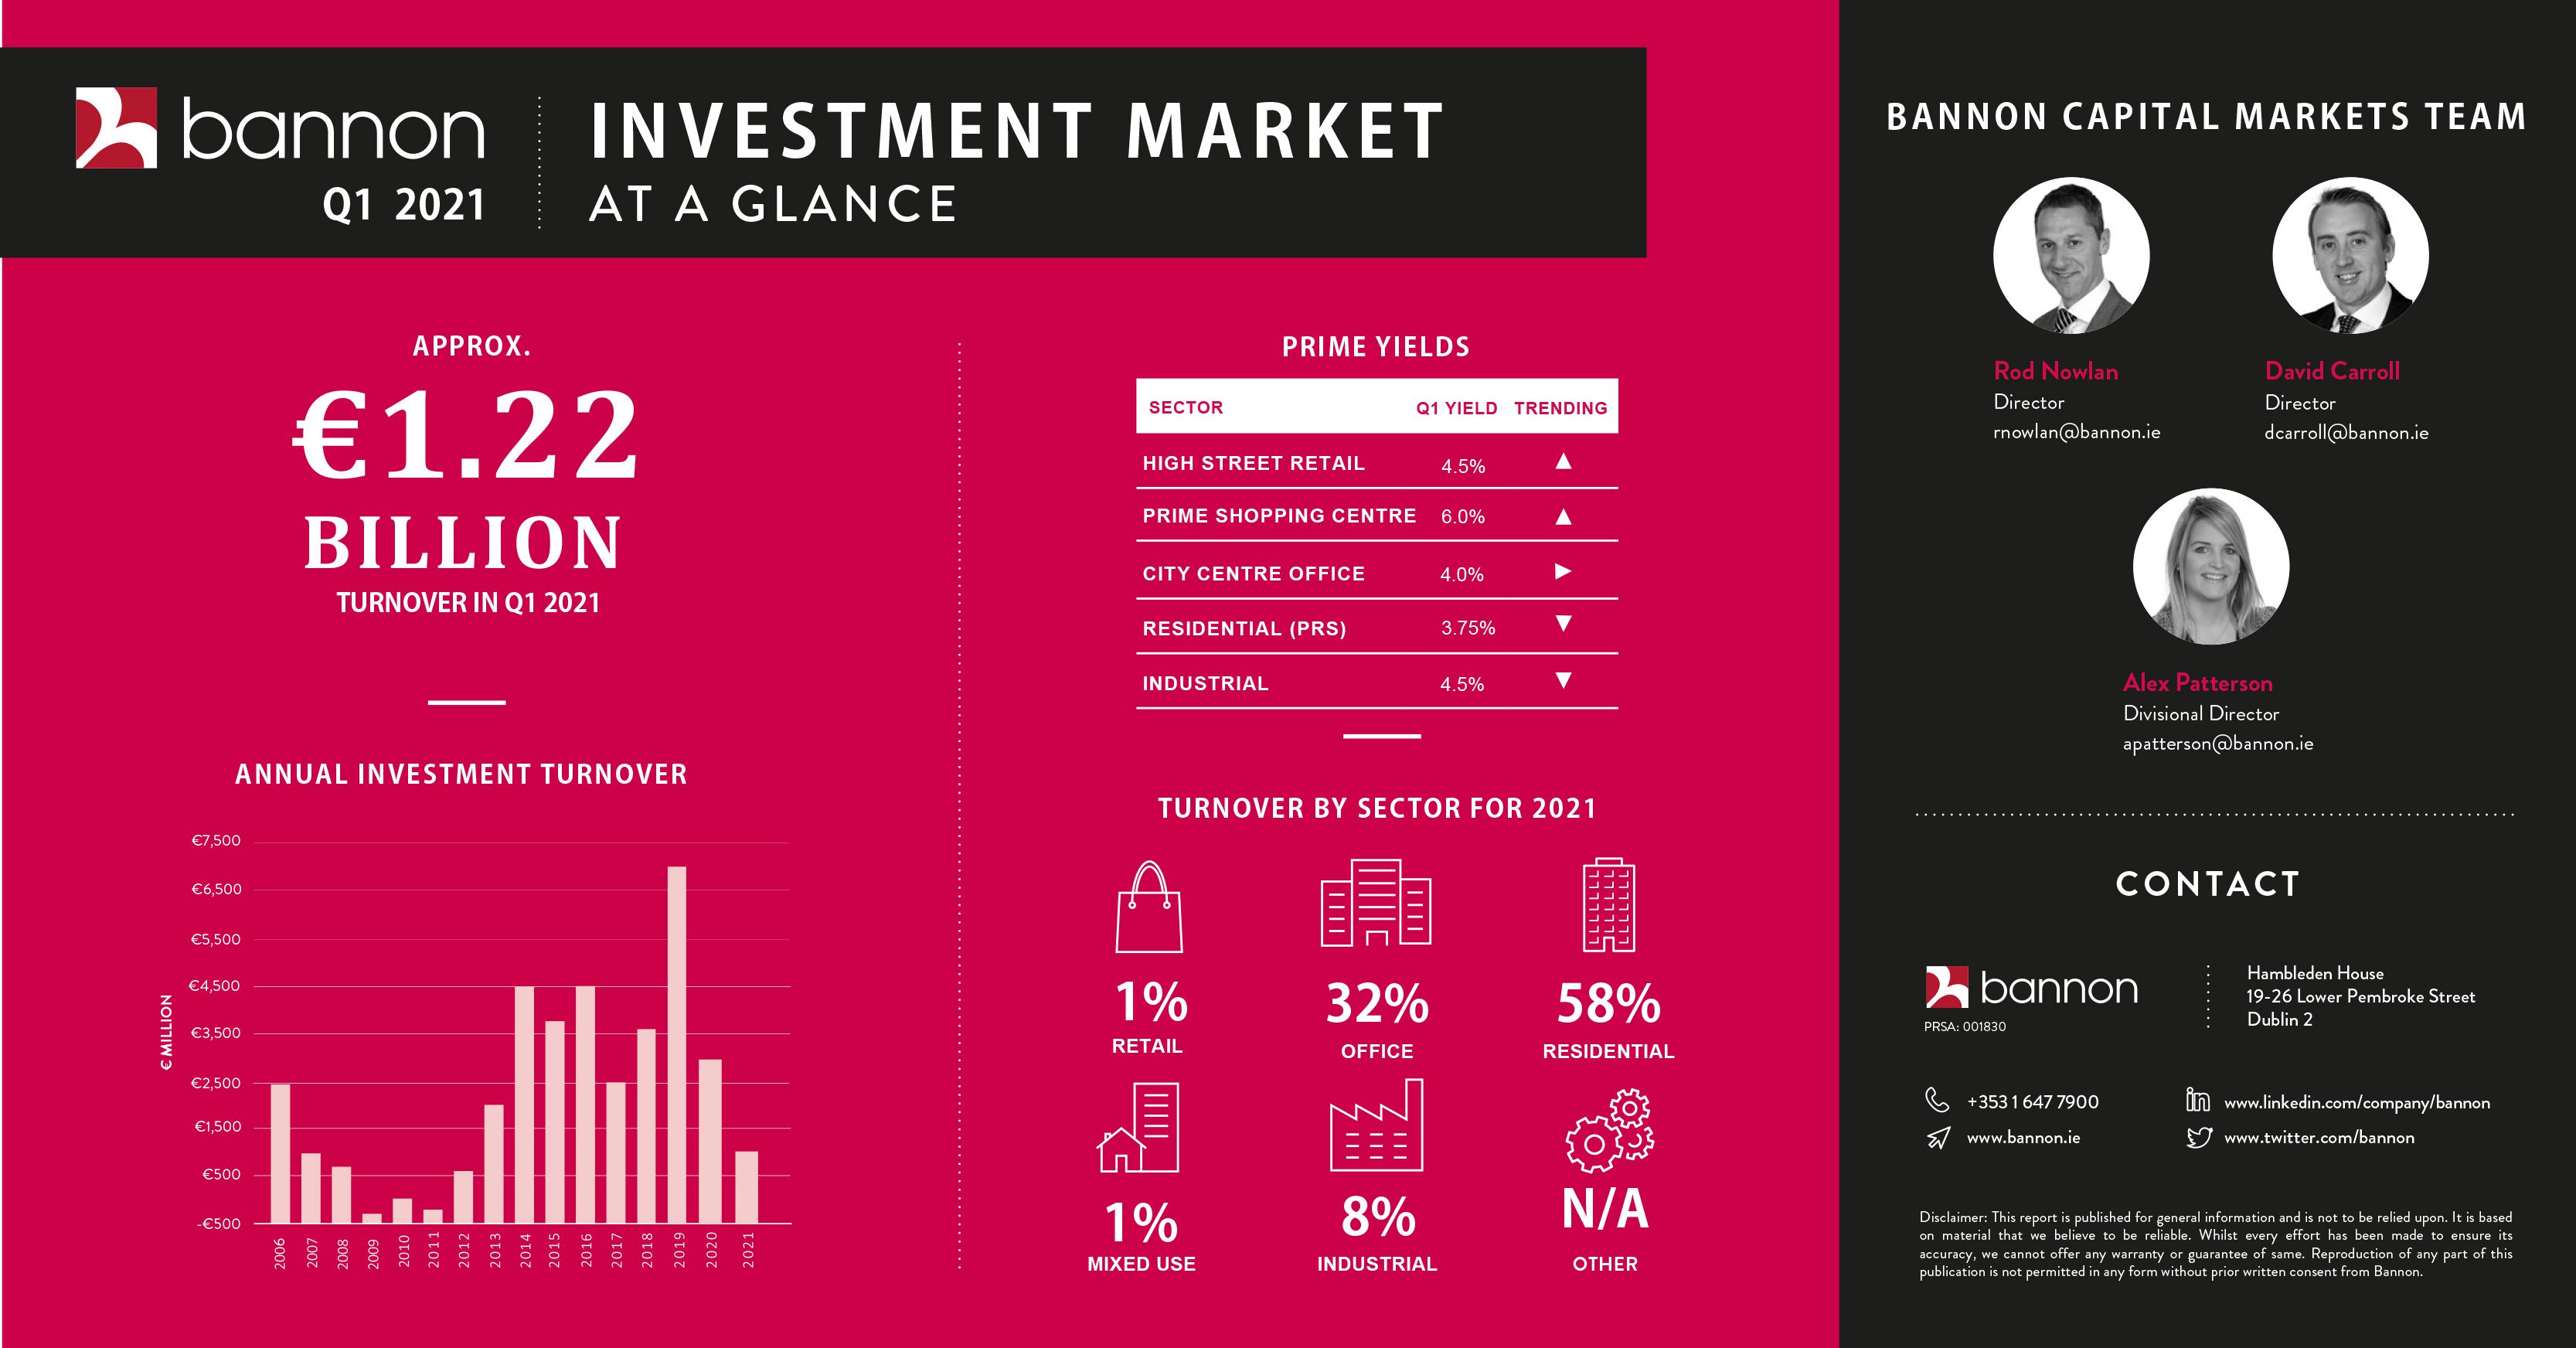
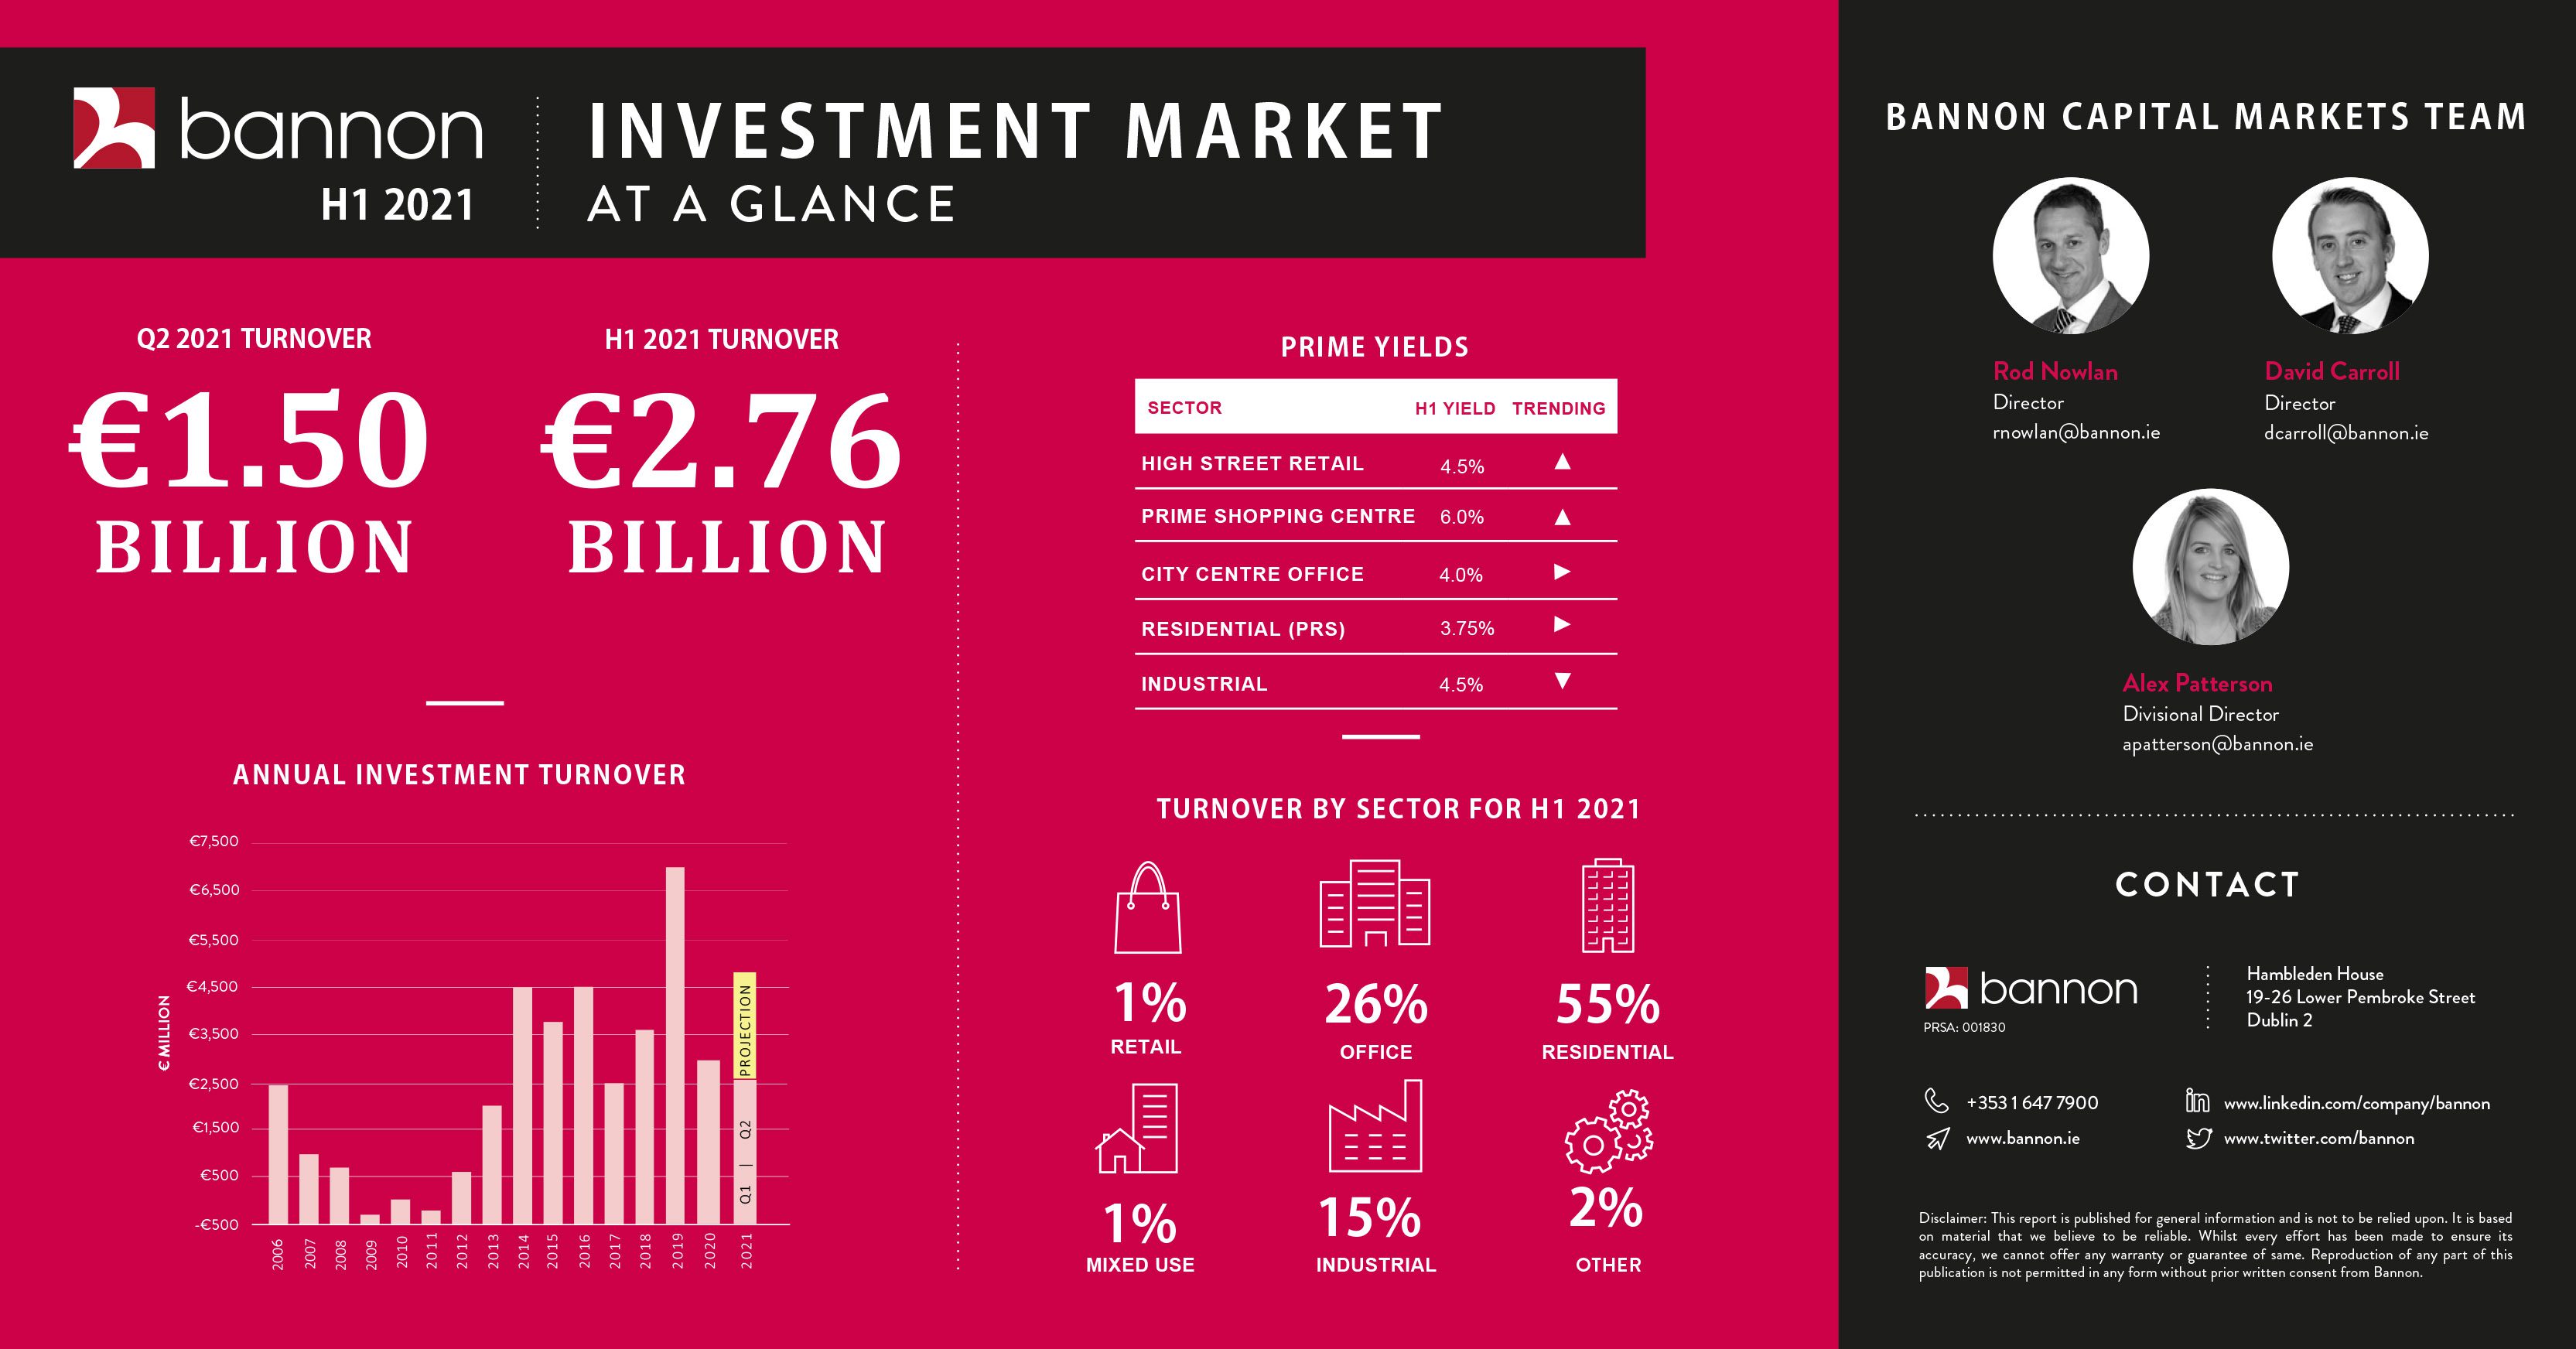
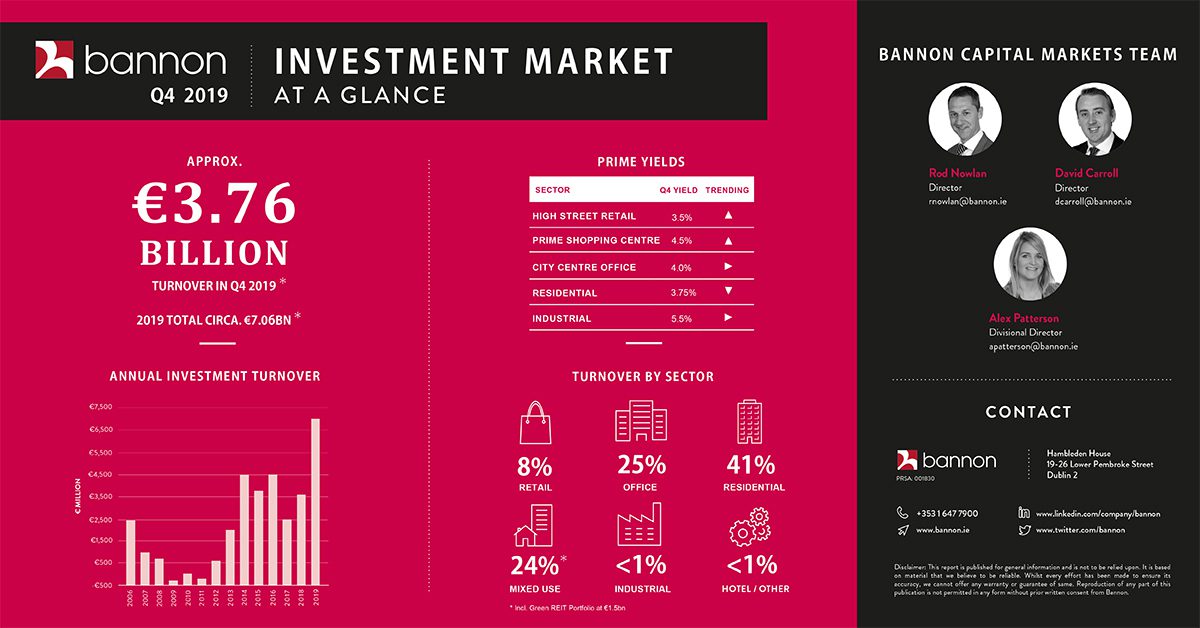
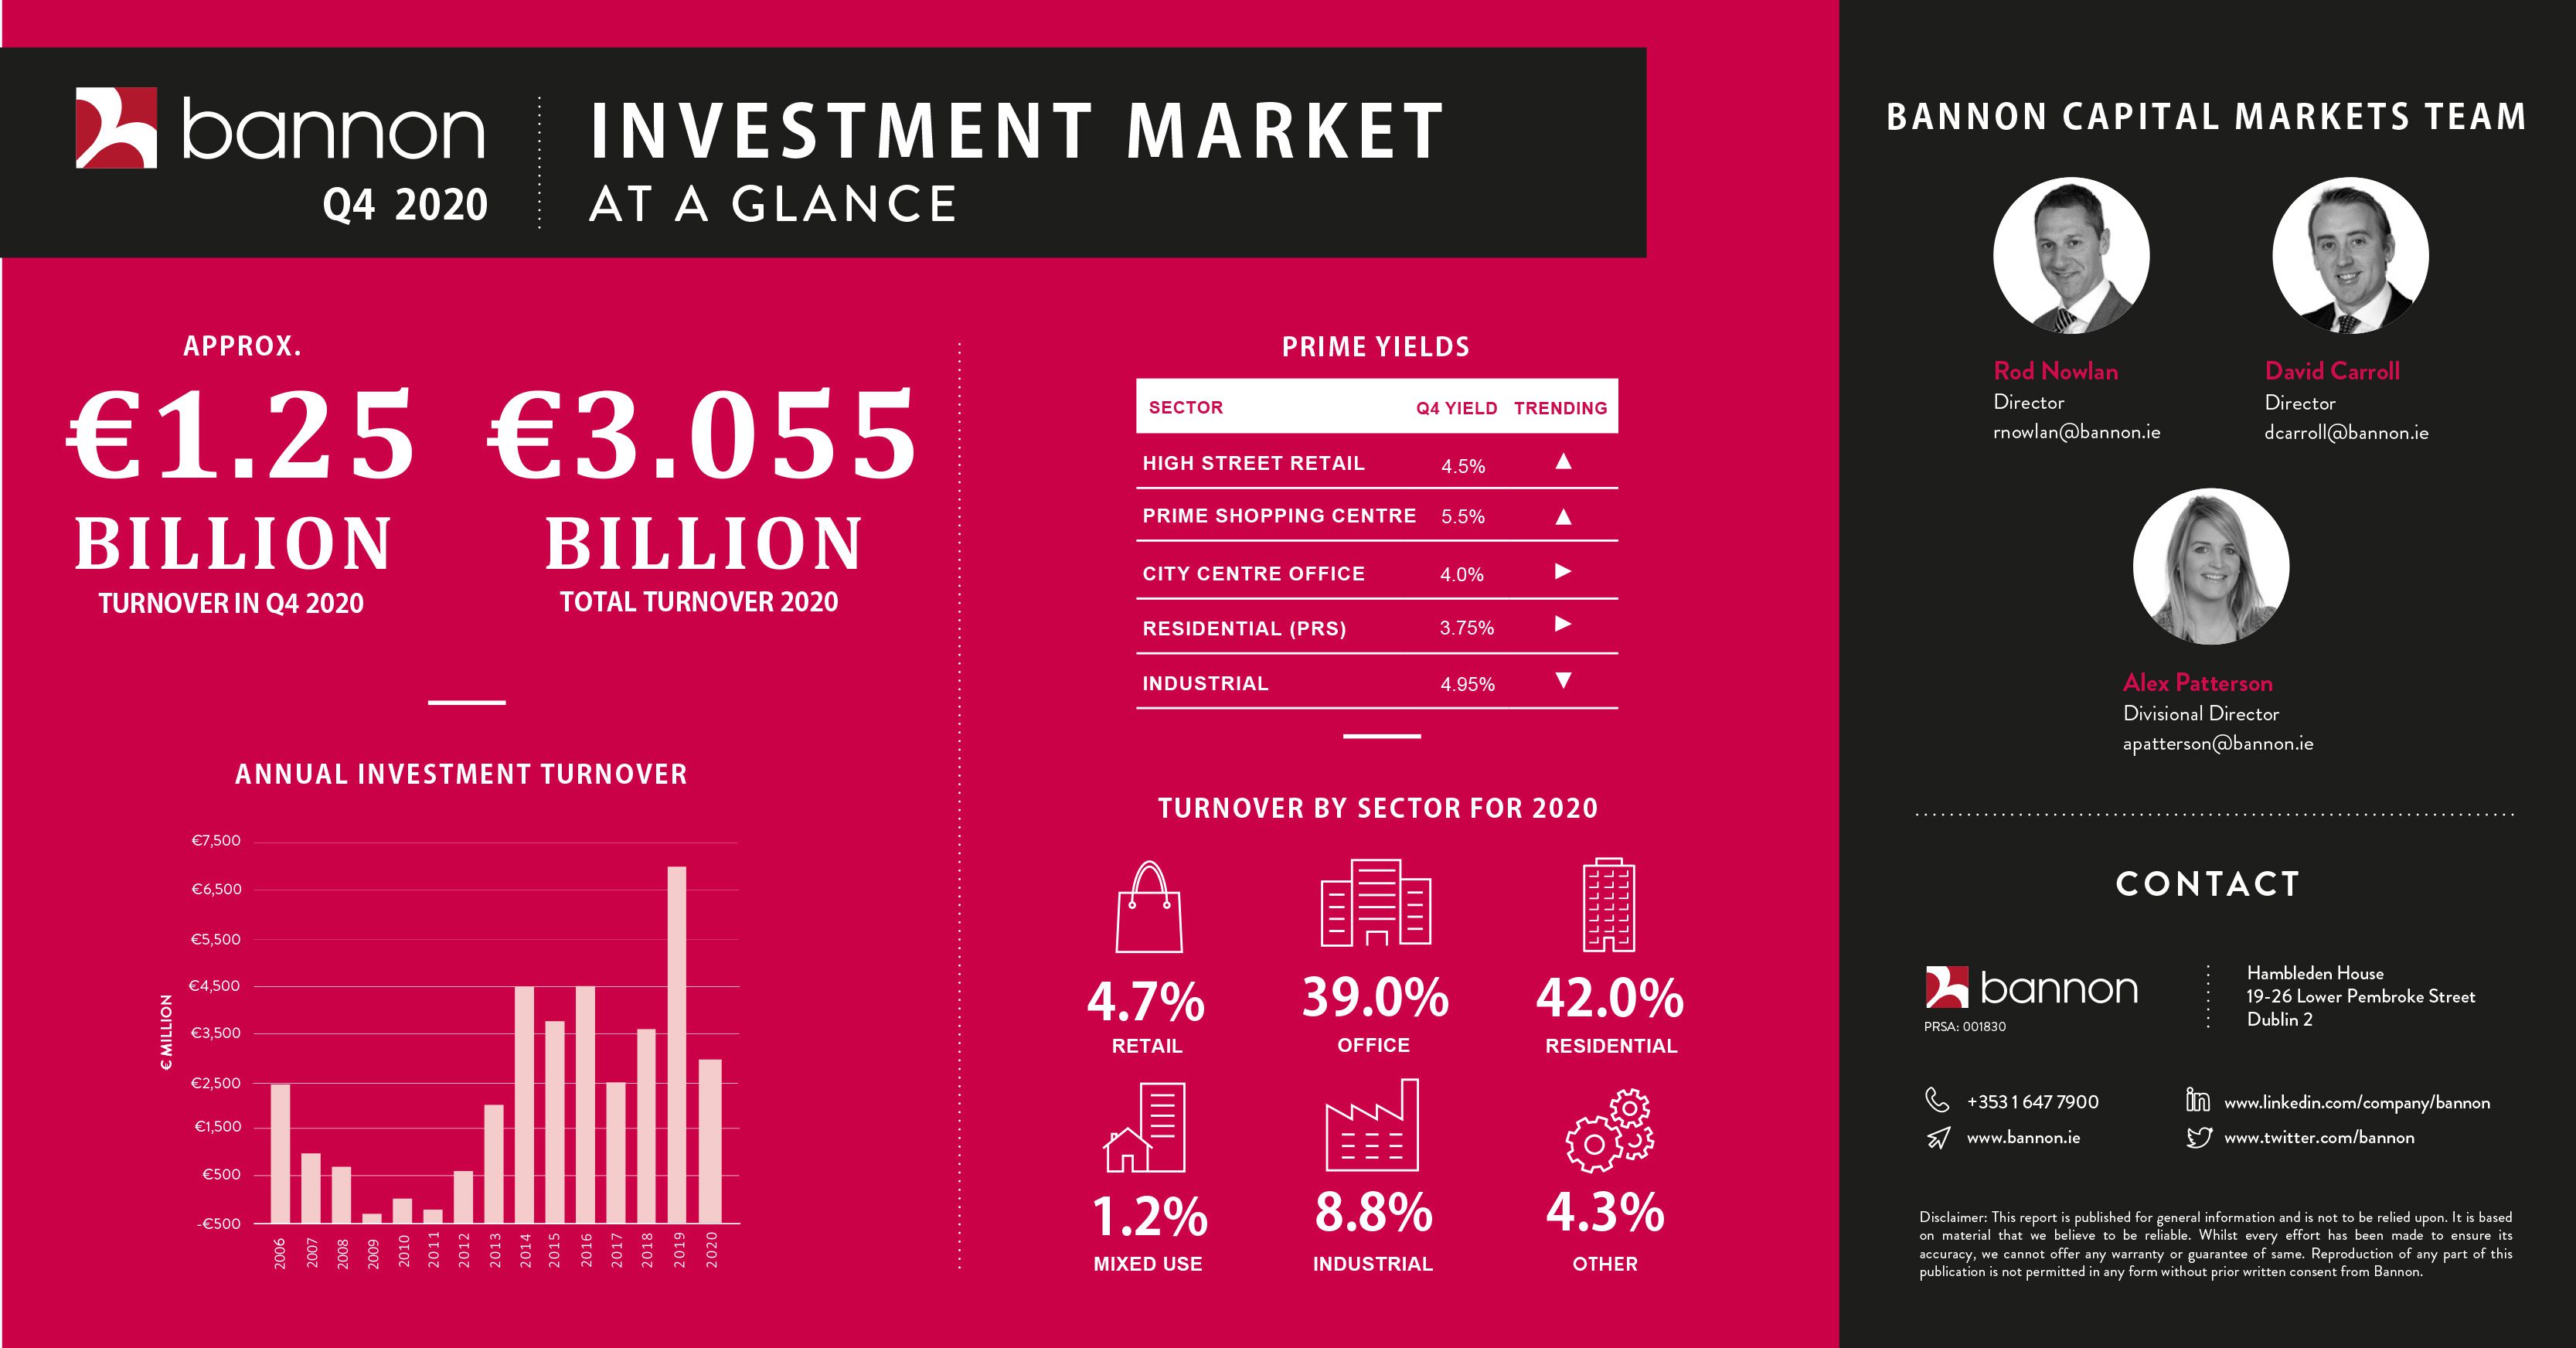
Last minute residential deal tips market over €3bn.
It’s difficult to imagine things getting any worse for the retail sector than they did in 2020. But the chief driving force behind the decline of investor interest began long before Covid-19 arrived. There has been growing concern in relation to the impact of online retail and changing consumer trends on the long-term supply-demand dynamic for the bricks-and-mortar format. Much of this has been imported from the US where retail supply is five times that of Ireland, and the UK where it is 25 per cent higher and undergoing a sustainability crisis.
While the relative performances of these markets may already have been up for debate, the impact of Covid has ended the discussion. By mid-March the sector became virtually un-investable due to Covid-related uncertainties attaching to rental payments being added to those longer-term occupational concerns. The consequence of this is manifest in year-end investment turnover figures where retail will represent a record low 2.5 per cent of an anticipated total investment market turnover of € 3 billion. This from a sector that represented 24 per cent of investment turnover for the last decade (to 2019), but descending rapidly from a high of 53 per cent in 2016 to a previous record low in 2019 of 9 per cent.
Unsurprisingly for 2020 High Street retail has been worst affected with Grafton Street top of the list experiencing a 66 per cent reduction in footfall for March to October. While the street’s footfall figures had been holding steady at 25 million for the last two years, the 2020 outcome will be closer to 13 million.
No surprise then that almost a quarter of the units on the street are effectively available. Henry Street performed a little better as did some of the other city’s high streets, but the tone is similar. Next in line were the “comparison led” shopping centres which, as a general rule, saw footfall collapse during the first lockdown and rent collections plummet below 35 per cent. However, they did improve quickly and were less affected by the second lockdown. The burden of the service charge costs of running these mall-based schemes was exposed during these periods and will be a key factor in assessing the risk of ownership of these asset types in the future.
The resilience of the grocery sector shone through. No surprise therefore that 65 per cent of the limited 2020 retail investment transactions were grocery deals. Similarly, smaller grocery-led schemes performed better and recovered quicker than major town centres but weaker covenant strength and holding costs affected net rental collections.
Low holding costs
The retail sector’s star performers, however, have been the retail parks. Indeed, in the case of the 15 retail parks under Bannon management (between nationwide lockdowns) car throughput actually increased year on year for the period with rent collection rates approaching 100 per cent and impressive turnover increases. Even where tenants were adversely affected, low holding costs relative to shopping centres maximised the net income return to landlords.
If this crisis has accelerated the sector’s movement to the “retail endgame”, then retail parks and their occupiers have risen to the challenge. In this regard we envisage this asset type, along with grocery, to be the most liquid and popular sector for the year ahead.
Outside of this and following both Brexit and an anticipated mid-January lockdown we foresee a post-vaccine period of rebuilding balance sheets and filling occupational voids. While this period could take 12 to 24 months, there is little doubt that the rebasing of the sector generally will attract new investors wishing to get ahead of the recovery. This will probably manifest as loan trades first with a focus on fundamentally-sustainable schemes and high streets at attractive yields with occupiers who have embraced the omnichannel experience.
More sophisticated investors will recognise the buying opportunity that Covid-19 presents, especially if valuers fail to acknowledge the vast differences in performance across the sector.
Rod Nowlan is investment director at Bannon
The Ireland-based commercial property practice will drive efficiencies in their property management portfolio and tenant management with the Yardi platform
DUBLIN, Ireland (16, November 20) – Bannon Commercial Property Consultants Ltd. (Bannon) will manage over 7 million square feet of real estate on Yardi® Voyager, a cloud-based property management and accounting platform. The firm will also adopt Yardi® Lease Manager for a comprehensive view of tenant activities and portfolio performance.
Lease Manager, part of the Yardi® Elevate Suite, offers extensive data and oversight options. Finance and asset management teams can visualise total number of deferrals and abatements and aging accounts receivable. Property management teams can oversee rent collection and tenant communications.
Bannon will also adopt the Yardi® Procure to Pay Suite, an end-to-end procurement solution that includes Yardi PAYScan® for paperless invoicing and VendorCafe® for centralised vendor management. CommercialCafe®, an easy-to-use, self-service tenant portal will digitalise tenant communication for Bannon. CommercialCafe enables tenants to make online payments, access lease records and manage service requests.
“We are looking forward to the benefits of a cloud-based property management solution. We provide a ‘best-in-class’ approach to outsourced property management with quality at the core and we see synergies in Yardi’s offering. The Voyager platform will ensure consistency and modernisation in the way we report and manage our clients’ assets,” said Richard Muldowney, director and head of finance at Bannon.
“Yardi continues to expand its presence in Ireland, one of the fastest-growing real estate markets in Europe. We’re excited to support Bannon with technology that will facilitate strategic growth,” said Neal Gemassmer, vice president of international at Yardi.
Learn more about how Yardi is supporting real estate and investment clients in the UK and across Europe.
About Bannon Commercial Property Consultants Ltd.
Bannon is the leading indigenous commercial property practice in Ireland with a particular emphasis and track record in the retail space. The firm currently has 75 assets under management. For more information on Bannon, please visit bannon.ie.
About Yardi
Yardi® develops and supports industry-leading investment and property management software for all types and sizes of real estate companies. Established in 1984, Yardi is based in Santa Barbara, Calif., and serves clients worldwide from offices in Australia, Asia, the Middle East, Europe and North America. For more information, visit yardi.co.uk.
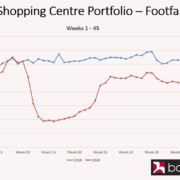
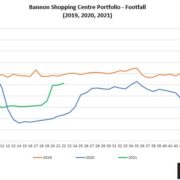
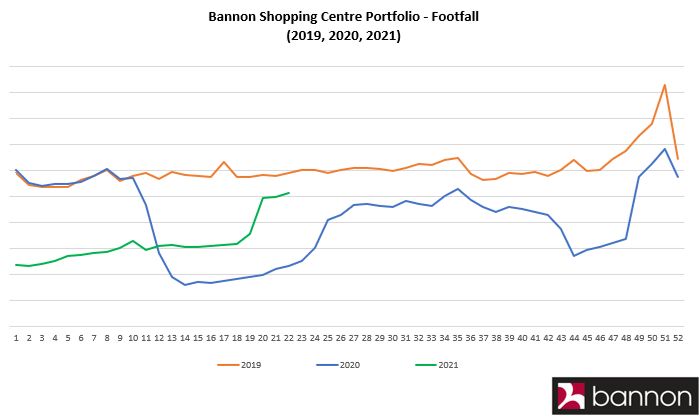
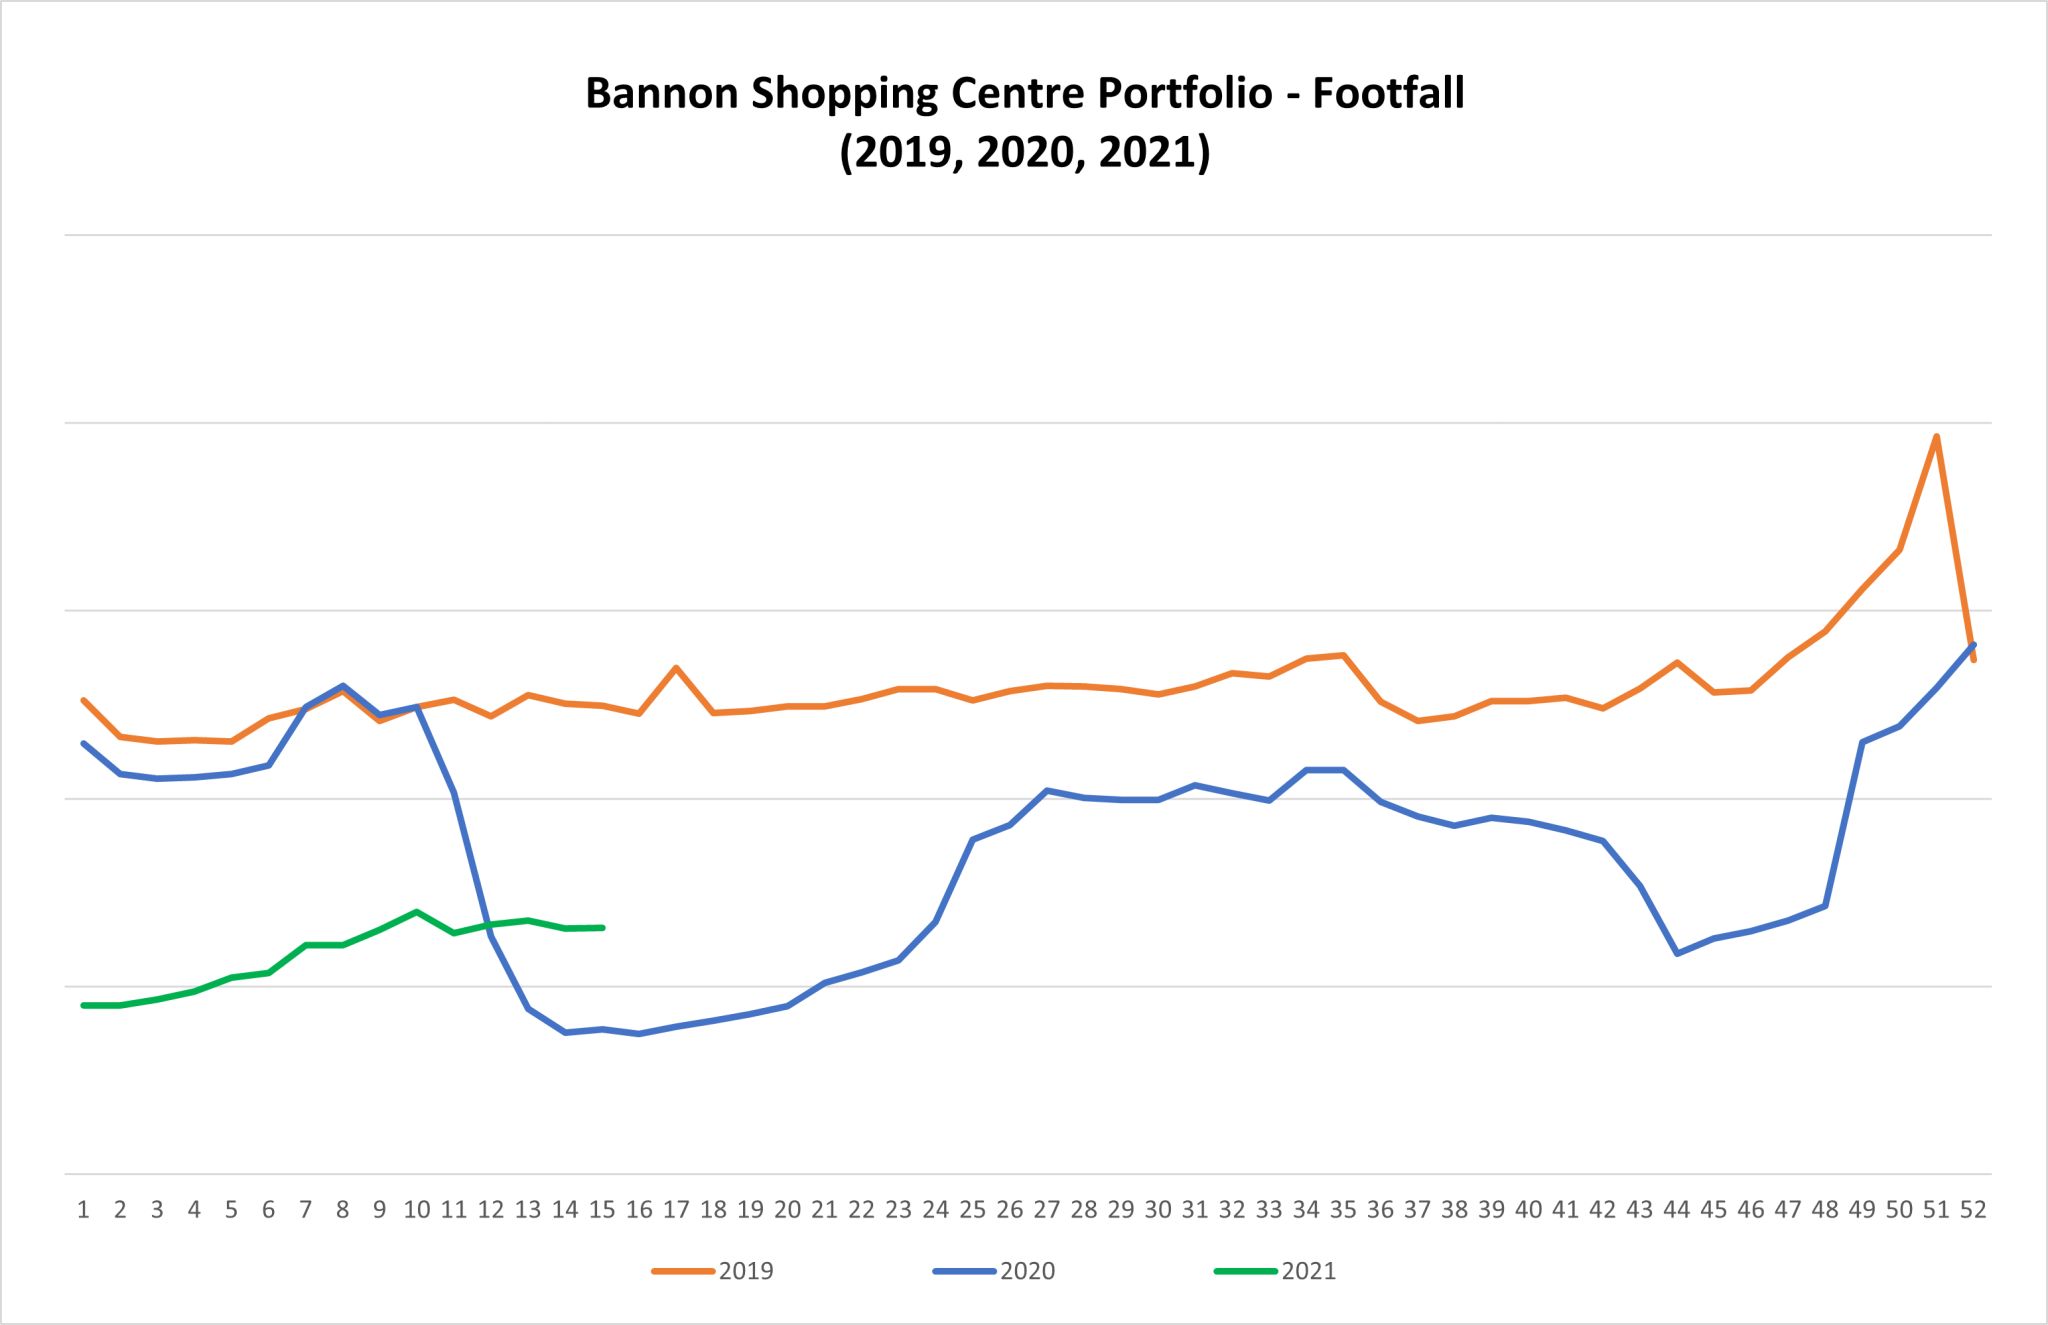
In general the footfall across our portfolio is remarkably consistent every year, however 2020 is very different. We remain hopeful that people will shop with purpose when the restrictions are eased at the start of December.
Businesses across the country need a strong finish to the year and we can all help to make it happen.
The inconsistent and illogical nature of the imposition of essential goods only sales in retail across the country is causing serious damage to the sector.
We have reports from across the portfolio of local Jewellers who are operating on a Click & Collect basis being told to pull their shutter, a news agency being advised that can sell cigarettes and lotto tickets but not books or magazines, a florist being told to close who traded during the last (and more severe) lockdown.
The government needs to think about where this spend will go. A customer told they cannot buy a magazine or a book in a shop that is already open is one click away from redirecting spend from a small local business to Jeff Bezos
September Retail Sales indicate that at least one part of the economy is definitely experiencing a K shaped recovery. The stellar numbers that continue to come out of the DIY sector (YOY: Hardware +27.6% YOY, Electrical +21.1% & Furniture +11.9%) contrast sharply with Bars which are predictably down 48%.
What’s interesting is that total value of retail sales was up 7.2% year on year which means Irish consumers spent a lot more this September than last year.
This was all before the lockdowns started again which if recent experience is anything to go by will exacerbate the K shaped nature of the market performance.
David Carroll, Investment Director – “Q3 2020 turnover of €681m continued to illustrate the domination of PRS investment versus other asset classes with circa. 70% of value attributed to the sector. Covid-19 impacts continue to effect the supply and demand factors of traditional investment sectors. There is now close to €2bn of office product being marketed publicly and privately thus Q4 should provide some clarity on where investor appetite is at”.
As per the Retail Sales figures released by the CSO and our own experience across our retail park portfolio DIY & Household goods sales have been the stand out performer of the Retail sector since March.
Retail Parks continue to perform well with rolling restrictions on other retail outlets redirecting spend into home improvements.
Interestingly this is a sector with very low levels on pure online penetration although we have been actively engaging with a number of occupiers about facilitating their client and collect offer.
Lucy Connolly – Divisional Director – “The anticipated impact of covid-19 on the Dublin office market translated to a take up figure of 75,000 sq.ft. this quarter. We do expect to see a busier Q3 with over 700,000 sq.ft. of accommodation reserved, with some large transactions close to completing in the coming weeks. We commenced the quarter on a positive note with the recent announcement that Gilead are to create 140 new jobs following their letting of over 30,000 sq.ft. at North Dock”.
With 3 transactions in excess of 100,000 sq. ft. take-up reached an impressive 1.2m sq. ft. in Q4. This brings the year-end total to 3.29m sq. ft. across 204 transactions. Full report to follow.
The strongest ever quarter for the Irish investment Market with total turnover for Q4 2019 reaching a staggering €3.76bn and total turnover for the 12 months of the year in excess of €7bn. To put the quarter in context it is higher than the entire annual turnover of the last cycle peak in 2006 of €3bn+ and annualised smashes this cycles 2016 peak of €4.5bn. PRS remained the most active sector accounting for 41% of transaction value. Full Report to follow.
The Irish economy looks set to register strong growth again in 2019 with GDP likely to increase by almost 6 per cent in the current year. While certain multi-national related transactions are distorting the headline figures, the large increase in taxation receipts and the continued strong performance of the Irish labour market means the underlying economy is performing well.
The persistent growth of the Irish economy is remarkable given the strong headwinds observed in 2019, the uncertainty about the Brexit process, and the moderation observed in global conditions, all of which are likely to have had a negative impact on the domestic economy. The Brexit process has merely been parked, with the possibility of a free trade agreement being negotiated between the UK and the EU in 2020. This will almost certainly result in further uncertainty in the years ahead. We expect to see the economy grow by a slower rate in 2020 of 3.3 per cent.
Another potential challenge for the Irish economy is the issue of corporation tax receipts, which are becoming an increasingly large share of the total tax receipts of the Irish exchequer. They now account for over 18 per cent of total tax receipts and there is concern that a portion of these receipts may be windfall revenues, which are not sustainable. ESRI economist Petros Varthalitis examines the implications for key fiscal metrics if there was a sudden reduction in the amount of corporation tax receipts available. It would likely require significant measures to be adopted by the Government in order to maintain fiscal discipline. The results underpin the need to quantify the potential windfall component of these receipts. They are also important given the recent proposals by the OECD for corporation tax policy.
The Commentary also examines the regional diversity of the Irish property market performance over the last 10 years. ESRI economists Matthew Allen-Coghlan and Kieran McQuinn note that both prices and rents have grown at significantly different rates in different areas of the country during this period. Areas of the country that had relatively high prices and rents initially experienced the fastest pace of growth subsequently. This suggests that different regions of the country have experienced varying economic growth rates over the past 10 years.
The seasonally adjusted unemployment rate for November 2019 was 4.8%, remaining unchanged from October 2019 and down from 5.6% in November 2018. The seasonally adjusted number of persons unemployed was 117,800 in November 2019, compared to 117,700 in October 2019. When compared to November 2018, there was an annual decrease of 17,600 in the seasonally adjusted number of persons unemployed.
Summary points for November
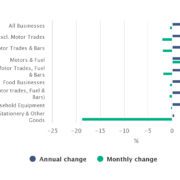
The volume of retail sales decreased 0.5% in October when compared to September on a seasonally adjusted basis and increased by 3.0% on an annual basis. When Motor Trades are excluded, the volume of retail sales decreased by 2.1% in October 2019 and rose by 3.2% when compared with October 2018.
The sectors with the largest month on month volume decreases were Other Retail Sales (-9.3%) and Fuel (-5.2%). The sectors with the largest monthly volume increases were Pharmaceuticals, Medical & Cosmetic Articles (8.1%) and Clothing, Footwear & Textiles (3.0%).
There was a decrease of 1.0% in the value of retail sales in October 2019 when compared with September 2019 and there was an annual increase of 1.4% when compared with October 2018. If Motor Trades are excluded, there was a decrease of 2.4% in the value of retail sales in the month and an increase of 0.5% in the annual figure.
There was an annual increase in employment of 2.4% or 53,700 in the year to the third quarter of 2019, bringing total employment to 2,326,900. This compares with an annual increase of 2.0% or 45,000 in employment in the previous quarter and an increase of 3.0% or 66,700 in the year to Q3 2018.
Residential property prices increased by 1.1% nationally in the year to September. This compares with an increase of 2.0% in the year to August and an increase of 8.5% in the twelve months to September 2018.
In Dublin, residential property prices decreased by 1.3% in the year to September – house prices decreased by 1.5% and apartments decreased by 0.2%. The highest house price growth in Dublin was in Fingal at 1.5%, while Dun Laoghaire-Rathdown saw a decline of 6.8%.
Residential property prices in Ireland excluding Dublin were 3.6% higher in the year to September, with house prices up by 3.4% and apartments by 4.8%. The region outside of Dublin that saw the largest rise in house prices was the Border at 11.8%, while the smallest rise was recorded in the Mid-East at 0.2%.
Overall Decline
Overall, the national index is 16.9% lower than its highest level in 2007. Dublin residential property prices are 21.4% lower than their February 2007 peak, while residential property prices in the Rest of Ireland are 20.0% lower than their May 2007 peak.
Recovery
Property prices nationally have increased by 85.3% from their trough in early 2013. Dublin residential property prices have risen 94.7% from their February 2012 low, whilst residential property prices in the Rest of Ireland are 84.0% higher than at the trough, which was in May 2013.
The seasonally adjusted unemployment rate for October 2019 was 4.8%, down from 4.9% in September 2019 and down from 5.7% in October 2018. The seasonally adjusted number of persons unemployed was 117,300 in October 2019, compared to 118,100 in September 2019. When compared to October 2018, there was an annual decrease of 19,400 in the seasonally adjusted number of persons unemployed.
Summary points for October
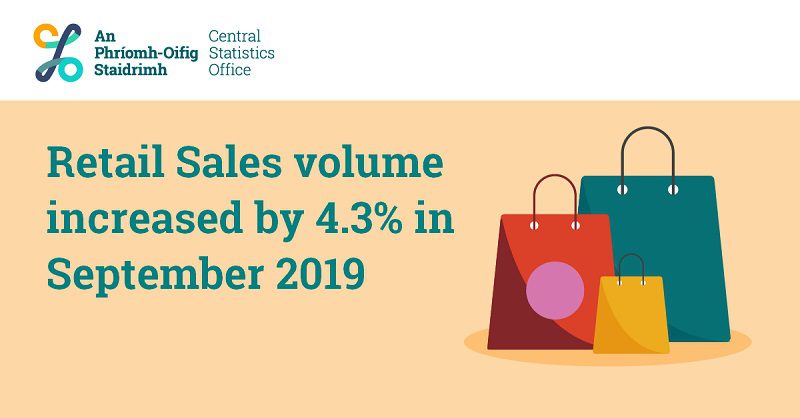
The volume of retail sales increased 4.3% in September when compared to August on a seasonally adjusted basis and increased by 4.2% on an annual basis. When Motor Trades are excluded, the volume of retail sales increased by 2.3% in September 2019 and rose by 4.7% when compared with September 2018.
The sectors with the largest month on month volume increases were Hardware, Paints & Glass (8.8%) and Motor Trades (8.4%). The sectors with the largest monthly volume decreases were Department Stores (-2.2%) and Clothing, Footwear & Textiles (-2.2%).
There was an increase of 3.8% in the value of retail sales in September 2019 when compared with August 2019 and there was an annual increase of 2.8% when compared with September 2018. If Motor Trades are excluded, there was an increase of 2.0% in the value of retail sales in the month and an increase of 2.1% in the annual figure.
The filing of its accounts confirmed last week that Smyths Toys is already making a financial return on its deal last year to acquire the central European operations of Toys R Us.
The family-owned group is now – individually and collectively – profitable in Ireland, the UK, Germany, Austria and Switzerland. That surely makes Smyths the most successful ever Irish retailer abroad.
The two biggest indigenous Irish grocers, Dunnes Stores and Musgrave, are larger, more storied, family-owned operations than Smyths. Yet the toy retailer has succeeded abroad where they have failed.
Dunnes and Musgrave both have operations in Spain, but in recent years both effectively abandoned their forays into Britain.
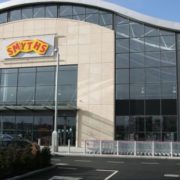
Smyths, meanwhile, has completely conquered the British market, opening more than 100 large retail outlets there in a little over a decade, vanquishing its specialist rivals. Its UK sales are now about €675 million.
Its prospects for maintaining growth in Britain are likely to slow as Brexit keeps sterling weakened, and Smyths runs out of unserviced locations to open new stores. As it already dominates the specialist Irish toys market, Smyths’ most obvious avenue for further growth became Europe.
The global insolvency last year of Toys R Us provided Smyths with a golden opportunity to buy out of bankruptcy the German-Swiss-Austrian stores of its US rival. The accounts filed last Friday show it paid less than €62 million to gain control of more than 90 outlets, which made Smyths profits of almost €14 million in 2018.
As it fine tunes them to better fit its sophisticated big box retailing model, their financial contribution may improve further.
The wider Smyths group is now on course for annual sales of close to €1.4 billion. Despite the success of its foreign forays, the group still made an annual profit of just €36 million.
With margins of less than 3%, Smyths may be tempted to expand its footprint even further if it wants to keep growing profits in years to come.
Foreign Direct Investment in Ireland 2017, a thematic publication exploring the impact of FDI and globalisation, shows over 300,000 jobs are directly linked to foreign investment into Ireland.
Despite a decrease of €54bn in the stock of Foreign Direct Investment into Ireland between 2016 and 2017, at €744bn (253% of GDP) investment still remains high in comparison to other EU countries showing the highly globalised nature of the Irish economy.
Employment figures show growth across all sectors since 2012, with the largest growth (28%) recorded in the scientific and technical activities sector. In 2017 average wages in foreign-owned multinational enterprises (MNEs), at €50,000, were significantly higher than those paid by domestic firms (€33,000), but lower than those paid by Irish MNEs (€57,000). All sectors experienced wage growth, with the largest growth in the information and communications sector and the administration and support services sector, which experienced 26% growth and 20% growth respectively between 2012-2017.
This is the second time the CSO has published this experimental publication linking data across statistical domains. Foreign Direct Investment in Ireland 2017 looks at the role of investment into Ireland, its associated globalisation and its role in the Irish domestic economy. This publication brings together several different data sources designed to complement the annual and quarterly Foreign Direct Investment statistics presented in our International Accounts.
New to this year’s publication is a breakdown of gender balance in FDI firms and an analysis of the influence of Special Purpose Entities (SPEs), distinguishing between actual investment in firms operating in Ireland and funds passing through via SPEs.
Residential property prices increased by 3.1% nationally in the year to April. This compares with an increase of 3.8% in the year to March and an increase of 13.3% in the twelve months to April 2018.
In Dublin, residential property prices rose by 0.5% in the year to April, with no change in house prices and apartments rising by 2.2%. The highest house price growth in Dublin was in South Dublin at 4.0%, while Dun Laoghaire-Rathdown saw the greatest decline in house prices (1.5%).
Residential property prices in Ireland excluding Dublin were 5.6% higher in the year to April, with house prices up by 5.8% and apartments by 5.9%. The region outside of Dublin that saw the largest rise in property prices was the Border at 11.4%, while the smallest rise was recorded in the Mid-East at 1.5%.
Overall Decline
Overall, the national index is 18.5% lower than its highest level in 2007. Dublin residential property prices are 22.5% lower than their February 2007 peak, while residential property prices in the Rest of Ireland are 21.8% lower than their May 2007 peak.
Recovery
Property prices nationally have increased by 81.9% from their trough in early 2013. Dublin residential property prices have risen 91.9% from their February 2012 low, whilst residential property prices in the Rest of Ireland are 79.9% higher than at the trough, which was in May 2013.
There was an annual increase in employment of 3.7% or 81,200 in the year to the first quarter of 2019, bringing total employment to 2,301,900. This compares with an annual increase of 2.3% or 50,500 in employment in the previous quarter and an increase of 2.9% or 62,400 in the year to Q1 2018.
Summary points for Q1 2019
The increase in total employment of 81,200 in the year to Q1 2019 was represented by an increase in full-time employment of 62,600 (+3.5%) and an increase in part-time employment of 18,600 (+4.1%).
On a seasonally adjusted basis, employment increased by 35,200 (+1.5%) over the previous quarter. This follows on from a seasonally adjusted increase in employment of 18,400 (+0.8%) in Q4 2018, an increase of 10,900 (+0.5%) in Q3 2018, an increase of 15,400 (+0.7%) in Q2 2018 and an increase of 7,400 (+0.3%) in Q1 2018.
Unemployment decreased by 18,600 (-14.0%) in the year to Q1 2019 bringing the total number of persons unemployed to 114,400. This is the twenty seventh quarter in succession where unemployment has declined on an annual basis.
The seasonally adjusted unemployment rate decreased from 5.6% in Q4 2018 to 5.0% in Q1 2019, while the seasonally adjusted number of persons unemployed decreased by 14,300 to 120,300.
The long-term unemployment rate decreased from 2.1% to 1.7% over the year to Q1 2019. Long-term unemployment accounted for 35.7% of total unemployment in Q1 2019.
The total number of persons in the labour force in the first quarter of 2019 was 2,416,300, representing an increase of 62,600 (+2.7%) over the year. This compares with an annual labour force increase of 31,900 (+1.4%) in Q1 2018. The number of persons not in the labour force in Q1 2019 was 1,480,200, an increase of 9,900 (+0.7%) over the year.
Employment
The annual increase of 81,200 (+3.7%) in employment was represented by an increase of 30,800 (+2.5%) in male employment and an increase of 50,400 (+5.0%) in female employment over the year.
Employment increased in 12 of the 14 economic sectors over the year (excluding Not stated). The largest rates of increase were recorded in the Transportation and storage (+11.4% or +10,800) and the Administrative and support service activities (+10.6% or 10,500) sectors.
The overall employment rate among persons aged 15-64 was 69.3% in Q1 2019 compared to 67.9% in Q1 2018.
The number of employees in Q1 2019 was 1,966,800, up 99,300 (+5.3%) over the year. The number of self-employed persons decreased by 14,500 (-4.3%) over the year to 323,900.
Unemployment
Male unemployment decreased by 7,800 (-10.6%) to 65,900 over the year to Q1 2019, while female unemployment decreased by 10,700 (-18.1%) to 48,400 over the same period.
The overall unadjusted unemployment rate decreased from 5.7% to 4.8% over the year to Q1 2019.
In the year to Q1 2019, the number of persons classified as long-term unemployed decreased by 9,300 (-18.5%), bringing total long-term unemployment to 40,900. Short-term unemployment decreased by 9,500 (-11.9%) over the year to 70,300.
The unemployment rate for 15-24 year olds (youth unemployment rate) decreased from 12.5% to 10.9% over the year to Q1 2019.
A series of Monthly Unemployment statistics was first issued by the CSO in 2015. The most recent publication was issued in May 2019 for reference month April 2019. The Monthly Unemployment release contains a series of monthly unemployment rates and volumes. These series are based primarily on the LFS and are compiled in accordance with agreed international practice. Data for more recent periods for which no LFS benchmark is available is adjusted for trends in the Live Register. These statistics are the definitive measure of Monthly Unemployment and replaced the SUR (which has been discontinued).
The previously published seasonally adjusted monthly unemployment figures are now revised with the availability of new LFS benchmark unemployment estimates for Q1 2019. The seasonally adjusted monthly unemployment rate for March 2019 is now revised from 5.4% to 4.7%, while the seasonally adjusted number of persons unemployed is revised from 131,400 to 114,400.
The provisional estimate for April 2019 has also been revised with the seasonally adjusted unemployment rate for April 2019 revised from 5.4% to 4.6%, while the seasonally adjusted number of persons unemployed is revised from 129,700 to 112,500.
Labour force
As with employment, the number of persons in the labour force is also influenced by changes in the size of the working age population (demographic effect). Up to the start of 2008 this demographic effect had been adding at least 30,000 to the labour force on an annual basis, primarily driven by net inward migration. This demographic effect peaked at over 90,500 in the second quarter of 2007.
With the decline in inward migration the positive demographic effect started to fall in the second half of 2007 and continued to decline throughout 2008 and 2009 before becoming negative in Q3 2009. The negative demographic effect continued for each quarter until Q1 2014. The demographic effect has been positive since Q2 2014 and in Q1 2019 a positive demographic effect contributed an increase of 36,000 to the overall change in the labour force.
In addition to the demographic effect, the change in the size of the labour force is influenced by changes in participation. While the overall participation rate increased by 0.5 percentage points to 62.0% over the year, the net result of changes in individual age groups for the same period was a positive participation effect of 26,600.
Of those persons not in the labour force, the number classified as being in the potential additional labour force was 108,200 in the first quarter of 2019.
International Comparisons
The employment rate in Ireland increased by 0.8 percentage points to 69.1% over the year to Q4 2018. The employment rate in the EU-28 in Q4 2018 was 68.9%.
The unadjusted unemployment rate among the EU-28 countries in the fourth quarter of 2018 was 6.6%, while the comparable rate in Ireland was 5.4%. The highest unemployment rates among the EU-28 countries in Q4 2018 were recorded in Greece and Spain (18.7% and 14.5% respectively), while the lowest rates of 2.0% and 3.2% were recorded in the Czech Republic and Germany respectively.
The latest figures available at the time of finalising this release indicate that the seasonally adjusted unemployment rate for the EU-28 for March 2019 was 6.4% compared to the revised seasonally adjusted monthly unemployment rate of 4.7% for Ireland for the same period.
Residential property prices increased by 3.9% nationally in the year to March. This compares with an increase of 4.3% in the year to February and an increase of 12.6% in the twelve months to March 2018.
In Dublin, residential property prices rose by 1.2% in the year to March, with house prices rising by 0.7% and apartments by 2.5%. The highest house price growth in Dublin was in South Dublin at 3.4%, while the lowest growth was in Dun Laoghaire-Rathdown at 0.4%.
Residential property prices in Ireland excluding Dublin were 6.8% higher in the year to March, with house prices up by 6.7% and apartments by 8.6%. The region outside of Dublin that saw the largest rise in property prices was the Mid-West at 11.9%, while the smallest rise was recorded in the Mid-East at 1.6%.
Overall Decline
Overall, the national index is 18.6% lower than its highest level in 2007. Dublin residential property prices are 22.3% lower than their February 2007 peak, while residential property prices in the Rest of Ireland are 22.3% lower than their May 2007 peak.
Recovery
Property prices nationally have increased by 81.6% from their trough in early 2013. Dublin residential property prices have risen 92.5% from their February 2012 low, whilst residential property prices in the Rest of Ireland are 78.8% higher than at the trough, which was in May 2013.
Irish retail sales values grew by 4.7% in the first quarter of the year when compared with the same period in 2018, aided by a ‘mild late winter’ and ‘early spring’, research showed.
While these figures are robust, it must be highlighted that in this period last year, Ireland found itself under a blanket of snow and was suffering the disruptive effects of Storm Emma, according to Retail Ireland latest Retail Monitor which the group published today.
“After a rocky fourth quarter of 2018, in which trade ebbed and flow almost by the day, retailers will be hoping that a level of consistency to trade can be found in 2019,” Thomas Burke, director of Retail Ireland, said.
“It is clear that retail sales patterns in the second half of 2018 were heavily impacted by Brexit related commentary.”
Brexit Extension
The Ibec group that represents the sector, highlighted in its report that an extension to the Brexit negotiating period until October seems to ‘have calmed nerves somewhat’.
“The daily game of brinkmanship is no longer leading news bulletins, and for hard-pressed Irish retailers this is good news. On the back of this we have seen an uptick in consumer sentiment as people’s worst fears of a crash out Brexit, have been allayed, at least for the moment.” Burke added.
There has also been a modest uptick in consumer confidence this quarter coming off the back of some respite from Brexit uncertainty which is reflected in the sales data.
Supermarkets and Convenience Stores
The report showed, that primary driver for volume over value growth continues to be ‘competitive action’ for supermarkets, with the battle for market share between multiples ‘very intense’ and the ‘slower but inexorable’ continuing growth of discounters also contributing to downward pressures.
A buoyant economy has been good news for the convenience sector, which is also in growth, the research indicated.
The Monitor also shows that while sales are up across almost all categories of retail, the ever-present trends of discounting and the continuing shift to online are also evident, particularly in retail categories such as computers and electrical goods and department stores.
In terms of the outlook for the remainder of the year, Burke highlighted that many businesses will have budgeted against the performance of Summer 2018.
“For those categories that are particularly reliant on good weather to drive footfall and sales, clearly this will prove challenging. With no guarantee of a similar prolonged spell of fine weather retailers will have to be creative if they are to achieve such heights once more.” he concluded.
Construction activity rose sharply in April while purchasing inventory also ratcheted up as companies seek to avoid Brexit-related supply disruptions, according to a survey from Ulster Bank.
The bank’s construction purchasing managers index (PMI) showed that business levels continue to rise underpinned by ongoing increases in the demand for construction work.
But Brexit still weighed on confidence and some companies surveyed noted lower demand while others said they would brought forward purchases to mitigate potential supply issues.
“Nevertheless, the April PMI indicate that construction remains the fast growing major sector of the economy, with growth continuing to outpace that reported in both manufacturing and services where international risks and headwinds, including those linked to Brexit, represent more of a challenge,” said Simon Barry, Ulster Bank’s chief economist in the Republic.
Housing, as opposed to commercial or civil engineering activity, recorded the fastest rise in activity for the fourth successive month during April. Commercial activity also increased, though at the slowest pace in six months while civil engineering activity declined.
Extra staff
Meanwhile, while job creation was quicker than the series average, employment growth eased slightly during April despite the fast rise in new business. “Anecdotal evidence from panellists indicated that extra staff had been hired in order to keep up with customer demand,” the survey said.
On pricing, the rate of input cost inflation slowed to a four-month low although there were reports of greater prices paid for steel, insulation and transport while left cost burdens high.
Overall, Irish construction companies picked up from a 68-month low during April, with just over 40% of those surveyed expecting activity to increase over the coming year. The relative positivity was linked to forecasts of increased sales activity, new capital investments and subsidence of Brexit uncertainty over the next 12 months.
The PMI rose to 56.6 in April, up from 55.9 in March.
The data from business and credit risk analyst, CRIF Vision-net, show an average of almost 71 new companies were formed every day in the first quarter of 2019, while the number of insolvencies remained consistent for the same period.
In total, 6,413 new companies were formed in Ireland in the first quarter of 2019, the best Q1 figures in the past 13 years, up almost 14% on the previously record-breaking Q1, 2018.
Professional services was the biggest contributor to new start-ups in the quarter which saw 1,448 new start-ups representing a 22% increase on this time last year.
Social and personal services grew by 50% with 945 new companies, while the third largest sector was financial services which, however, fell by 1% to 708 new start-up companies (compared to 715 in Q1 2018).
Construction saw a modest 1% growth during this time.
In total, 12 counties recorded double-digit growth in start-ups in Quarter One with Dublin recording the highest number, 3,089, amounting to almost 50% of the total number of start-ups established.
Cork followed with 690 new companies in the first quarter, up 13.3%, with Galway coming in third with 236 new start-ups, down by just 1.2% on the first quarter of 2018. Limerick saw 210 new start-ups created, representing a 7.7% increase on the same period last year.
The growth in company start-ups wasn’t limited to the counties with the largest urban populations. Louth (up 21%), Donegal (up 16.5%), Kerry (up 7%), Wicklow (up 14%) and Wexford (up 38%) all saw significant increases in new company start-ups.
2018 saw an almost 26% year-on-year drop in insolvencies when compared to 2017 and in the first quarter of this year, insolvencies have remained relatively low at 192, equating to an average of two a day.
It compares to a total of 186 in the same period for 2018.
Wholesale and retail was the most insolvent sector in the first three months of 2019 with 31 recorded insolvencies, up 34.8% on the Q1 figures for 2018. It was equalled by professional services also with 31 recorded insolvencies, up 10.7% on the first quarter of 2018 and was followed by the construction sector with 25 recorded insolvencies, down by 13.8% on Q1 2018.
Dublin was the most insolvent county for the period (84, up 9%), followed by Galway (14, up 133%) and Cork (13, down 43.5%).
However, counties Clare, Carlow, Mayo, Westmeath, Waterford, Kilkenny, Tipperary and Laois all recorded fewer than five insolvencies in the first quarter of this year and the number of insolvencies in counties Sligo and Offaly went down by 100% when compared to the same period in 2018.
In the year to July, residential property prices at national level increased by 10.4%. This compares with an increase of 11.9% in the year to June and an increase of 11.6% in the twelve months to July 2017.
In Dublin, residential property prices increased by 7.2% in the year to July. Dublin house prices increased 6.5%. Apartments in Dublin increased 11.0% in the same period. The highest house price growth was in Dún Laoghaire-Rathdown, at 9.8%. In contrast, the lowest growth was in South Dublin, where house prices increased 5.2%.
Residential property prices in the Rest of Ireland (i.e. excluding Dublin) were 13.7% higher in the year to July. House prices in the Rest of Ireland increased 13.1% over the period. The Mid-West region showed the greatest price growth, with house prices increasing 23.7%. The Border region showed the least price growth, with house prices increasing 6.0%. Apartment prices in the Rest of Ireland increased 18.7% in the same period.
Overall Decline
Overall, the national index is 18.8% lower than its highest level in 2007. Dublin residential property prices are 21.8% lower than their February 2007 peak, while residential property prices in the Rest of Ireland are 23.1% lower than their May 2007 peak.
Recovery
From the trough in early 2013, prices nationally have increased by 81.3%. Dublin residential property prices have increased 93.8% from their February 2012 low, whilst residential property prices in the Rest of Ireland are 76.9% higher than the trough, which was in May 2013.
Ireland Consumer Confidence was reported at 107.6 in July from 102.1 in the previous period. It was expected at 101.5.
Consumer Confidence in Ireland increased to 107.60 Index Points in July from 102.10 Index Points in June of 2018. Consumer Confidence in Ireland averaged 87.92 Index Points from 1996 until 2018, reaching an all time high of 130.90 Index Points in January of 2000 and a record low of 39.60 Index Points in July of 2008.
In Ireland, the Consumer Sentiment Index survey covers a minimum of 1,100 households across all regions of the country. The questionnaire assesses respondents’ perceptions on the general economy in the previous 12 months as well as expectations for next 12 months; perceptions of recent trends in unemployment and inflation; recent trends and likely future evolution in the household’s financial situation as well as savings and major purchases intentions. The Consumer Sentiment Index is calculated as the percentage of favourable replies minus the percentage of unfavourable replies, plus 100. The indicator varies on a scale of 0 to 200; a value of 0 indicates extreme lack of confidence, 100 neutrality and 200 extreme confidence. This page provides the latest reported value for – Ireland Consumer Confidence – plus previous releases, historical high and low, short-term forecast and long-term prediction, economic calendar, survey consensus and news. Ireland Consumer Confidence – actual data, historical chart and calendar of releases – was last updated on August of 2018.
source: tradingeconomics.com
The seasonally adjusted unemployment rate for April 2018 was 5.9%, down 0.1% from the revised rate of 6.0% in March 2018 and down from 6.8% in April 2017. The seasonally adjusted number of persons unemployed was 140,300 in April 2018, down from 143,500 when compared to the March 2018 figure and a decrease of 16,700 when compared to April 2017.
Summary points for April
In the year to February, residential property prices at national level increased by 13.0%. This compares with an increase of 12.0% in the year to January and an increase of 9.7% in the twelve months to February 2017.
In Dublin, residential property prices increased by 12.7% in the year to February. Dublin house prices increased 12.3%. Apartments in Dublin increased 14.5% in the same period. The highest house price growth was in Dublin City, at 14.2%. In contrast, the lowest growth was in Dun Laoghaire-Rathdown, where house prices increased 9.6%.
Residential property prices in the Rest of Ireland (i.e. excluding Dublin) were 13.3% higher in the year to February. House prices in the Rest of Ireland increased 13.1% over the period. The Midland region showed the greatest price growth, with house prices increasing 14.8%. The South-East region showed the least price growth, with house prices increasing 8.6%. Apartment prices in the Rest of Ireland increased 14.6% in the same period.
Overall Decline
Overall, the national index is 21.8% lower than its highest level in 2007. Dublin residential property prices are 23.0% lower than their February 2007 peak, while residential property prices in the Rest of Ireland are 27.5% lower than their May 2007 peak.
Recovery
From the trough in early 2013, prices nationally have increased by 74.6%. Dublin residential property prices have increased 90.6% from their February 2012 low, whilst residential property prices in the Rest of Ireland are 66.7% higher than the trough, which was in May 2013.
The economy grew by 7.8% of GDP last year, according to preliminary estimates from the Central Statistics Office, making it the European Union’s fastest-growing economy for the fourth year in a row.
Measured by GNP, the economy grew by 6.6% in 2017, the CSO said.
The CSO said that Modified Domestic Demand – a new measure used in Ireland to remove the distorting effects of foreign multinational companies – showed growth of 3.9%.
This suggests that the wider economy is feeling little initial impact from Brexit.
Today’s figures show that Personal Consumption Expenditure grew by 1.9%. This is regarded as an important barometer of the performance of the domestic economy.
Consumer spending on goods increased by 4.6%, while spending on services was marginally negative at -0.1%.
The CSO said that industrial output grew by 8.9%. In the ICT sector output increased by 16.8%, while financial and insurance output fell slightly, down by 0.7%.
Capital investment showed a drop of 22.3% last year, driven by a lower level of Intellectual Property imports when compared with the exceptionally high level of such imports in 2016.
The country’s balance of payments recorded a strong surplus of €37.1 billion, or 12.5%, of GDP.
This compared to a surplus of €9.1 billion in 2016, and €28.6 billion in 2015. The series was also affected by the large level of IP imports in 2016.
The relevance of using GDP as an accurate measure for such an open economy as the Irish economy was called into question when 2015 growth figures were adjusted up after a massive revision to the stock of capital assets related to the large multinational sector here.
While other more stable data point to very strong growth in the real economy, last year net exports were flattered greatly by the absence of large imports of intellectual property and aircraft leasing activity, which have skewed data in the past.
That pushed GDP up 10.9% year-on-year in the third quarter, revised slightly higher today.
This meant annual growth stood at 8.4% in the final three months of the year.
The economy expanded by 3.2% on a quarterly basis from October to December, compared with 4.8% in the previous quarter.
Ireland has rebounded from an economic crash a decade ago that pushed it into an international bailout in 2010, and the momentum has continued into this year with unemployment falling to 6.1% from a peak of 16% during the the crisis.
Data yesterday showed that employment – which analysts say is the cleanest gauge of Irish growth – was just shy of the 2007 peak at 2.23 million at the end of 2017 following a sharp rise in jobs growth in the fourth quarter.
Seasonally adjusted, the volume of retail sales decreased by 0.6% in the month of January, with an annual increase of 1.3%. If Motor Trades are excluded, there was an increase of 1.1% in the volume of retail sales in January 2018 when compared with December 2017 and there was an increase of 5.7% in the annual figure.
The sectors with the largest monthly volume decreases were Department Stores (-4.2%) and Motor Trades (-0.9%). The sectors with the largest month on month volume increases were Other Retail Sales (18.4%) and Pharmaceuticals,Medical & Cosmetic Articles (8.1%).
There was an increase of 0.7% in the value of retail sales in January 2018 when compared with December 2017 and there was an annual decrease of 0.7% when compared with January 2017. If Motor Trades are excluded there was an increase of 0.8% in the month and an increase of 3.2% in the annual figure.
CSO reports
Ireland is the world’s eighth-most “inclusive” advanced economy, based on a measure from the World Economic Forum (WEF), which looks beyond economic growth data to examine living standards, environmental sustainability and protection of future generations from indebtedness.
The ranking marks an improvement on Ireland’s 12th place among 29 advanced economies in a previous report published by the WEF, organisers of the annual Davos conference taking place this week.
“Our reliance on GDP [gross domestic product] of national economic achievement is fuelling short-termism and inequality, and leaders must urgently move to a new model of inclusive growth and development,” according to the WEF report, published on Monday, on the eve of the four-day gathering in the Swiss ski resort.
“Decades of prioritising economic growth over social equity has led to historically high levels of wealth and income inequality and caused governments to miss out on a virtuous circle in which growth is strengthened by being shared more widely and generated without unduly straining the environment or burdening future generation,” it said.
The WEF gathering of the world’s political and corporate leaders, alongside a smattering of celebrities, at Davos every year since 1971 has itself been criticized over the decades for its perceived elitist nature.
This year’s attendees include US president Donald Trump, Taoiseach Leo Varadkar, Minister for Finance Paschal Donohoe, French president Emmanuel Macron along with Bank of America chief executive Brian Moynihan, Microsoft CEO Satya Nadella, actress Cate Blanchett and musician and producer Will.i.am.
Norway has topped the list of the worlds’ most inclusive advanced economies, followed by Iceland, Luxembourg, Switzerland and Denmark. The UK came in 22nd and the US 23rd, with Italy, Portugal and Greece taking the bottom three slots on the list of 29 countries.
The index looks at a series of gauges, from GDP per capita to life expectancy, employment rates, median income, public debt, carbon emissions based on the size of the economy and ratio of the young and elderly depending on people in the workforce.
Article in the Irish Times
The seasonally adjusted unemployment rate for December 2017 was 6.2%, down from the revised rate of 6.4% in November 2017 and down from 7.5% in December 2016.
The seasonally adjusted number of persons unemployed was 146,700 in December 2017, down from 149,900 when compared to the November 2017 figure and a decrease of 26,900 when compared to December 2016.
Summary points for December
CSO reports
It is estimated that Irish shoppers spent an extra €90m on groceries over the festive period, according to the latest grocery market share figures from Kantar Worldpanel in Ireland, published today for the 12 weeks ending 31 December 2017.
Among the retailers, Dunnes Stores remained the top Irish supermarket. The grocer captured a market share of 23.0% – up 0.3 percentage points on this time last year – and achieved its strongest sales growth since May 2017, up 4.9%. Dunnes Stores’ customers remain loyal to the store, with perks such as the ‘Shop and Save’ campaign encouraging customers to add extra items to their shopping baskets.
Tesco also performed strongly, achieving its highest sales growth since February 2011, up 5.8%. The supermarket’s impressive growth helped it increase its market share by 0.5 percentage points compared to this time last year, and it now stands at 22.8%. SuperValu clocked in sales growth of 2.0%, with the grocer encouraging customers to spend an extra 70 cents every time they shop.
Historically, Kantar say shoppers have chosen to trade up over the Christmas period, however, Lidl seems to have broken the trend this year. The retailer enjoyed a positive performance over the Christmas period, with market share rising to 10.4% thanks to sales growth of 4.8%. While Aldi saw sales rise by 0.9% this was below the overall market level and led to a slight dip in market share – down 0.3 percentage points compared to this time last year.
According to the figures, the trend towards online shopping is showing no signs of slowing down. Online grocers experienced impressive sales growth of 24%, which boosted their share of the market to a record 2.3% over the Christmas period. Although grocery e-commerce shoppers haven’t increased in number, customers who already shop online have upped the frequency of their purchases with, on average, one extra order placed over this period.
Commenting on the figures, Director at Kantar Worldpanel, David Berry said, “Over the Christmas period the average household spent a record €1,532 on groceries – an increase of €38 compared to last year. Much of this increase has been driven by staple items, with fruit, vegetables, meat and poultry posting a combined sales increase of €28m. Shoppers were also partial to a Christmas tipple with sales of alcohol up almost 6% – a boost of €13 million. Wine was the drink of choice this year with white wine and red wine sales up an impressive 10% and 12% respectively.”
Article in the www.businessworld.ie
In the year to November, residential property prices at national level increased by 11.6%. This compares with an increase of 11.8% in the year to October and an increase of 9.2% in the twelve months to November 2016.
In Dublin, residential property prices increased by 11.3% in the year to November. Dublin house prices increased 11.5%. Apartments in Dublin increased 11.8% in the same period. The highest house price growth was in Dublin City, at 13.3%. In contrast, the lowest growth was in Dun Laoghaire-Rathdown, with house prices rising 10.8%.
Residential property prices in the Rest of Ireland (i.e. excluding Dublin) were 11.7% higher in the year to November. House prices in the Rest of Ireland increased 11.6% over the period. The West region showed the greatest price growth, with house prices increasing 16.0%. The Mid-West region showed the least price growth, with house prices increasing 8.9%. Apartment prices in the Rest of Ireland increased 13.2% in the same period.
Overall Decline
Overall, the national index is 23.1% lower than its highest level in 2007. Dublin residential property prices are 24.1% lower than their February 2007 peak, while residential property prices in the Rest of Ireland are 29.2% lower than their May 2007 peak.
Recovery
From the trough in early 2013, prices nationally have increased by 71.6%. Dublin residential property prices have increased 88.1% from their February 2012 low, whilst residential property prices in the Rest of Ireland are 62.8% higher than the trough, which was in May 2013.
CSO reports
The volume of retail sales increased by 2.6% in the month of November, with an annual increase of 6.8%. If Motor Trades are excluded, there was an increase of 1.9% in the volume of retail sales in November 2017 when compared with October 2017 and there was an increase of 7.6% in the annual figure.
The sectors with the largest monthly volume increases were Electrical Goods (14.5%), Department Stores (6.7%) and Other Retail Sales (5.7%). The sectors with the largest month on month volume decreases were Pharmaceuticals Medical & Cosmetic Articles (-11.2%), Bars (-1.5%) and Books, Newspapers and Stationery (-1.2%).
There was an increase of 2.6% in the value of retail sales in November 2017 when compared with October 2017 and there was an annual increase of 4.4% when compared with November 2016. If Motor Trades are excluded there was an increase of 1.2% on the month and an increase of 4.5% in the annual figure.
CSO reports
The volume of retail sales was up 4.5% in October compared with the same period last year, but was flat compared with September, the latest figures from the Central Statistics Office show.
If motor trades are excluded, there was a decrease of 0.3% in the volume of retail sales in October compared with September, and there was an increase of 6% in the annual figure.
The sectors with the largest monthly volume increases were pharmaceuticals, medical and cosmetic articles (7.3%); fuel (1.3%); and clothing, footwear and textiles (1.3%).
The sectors with the largest month-on-month volume decreases were books, newspapers and stationery (-2.5%); electrical goods (-2.1%); and other retail sales (-2.1%).
There was a decrease of 0.1% in the value of retail sales in October compared with September and there was an annual increase of 2.5% compared with October last year.
If motor trades are excluded, there was a decrease of 0.3% on the month and an increase of 3.7% in the annual figure.
An analyst with Davy said the data showed “something of a pause in growth” last month, but that the outlook “remains positive” with employment and wages continuing to grow strongly.
Merrion economist Alan McQuaid said retail sales “remain erratic” on a monthly basis, but that the underlying trend is “positive”.
“While most attention has been on new car sales in the past couple of years, which will be lower in 2017 than 2016, personal spending in other areas has picked up over the same period and is becoming more broad-based,” he said.
“Despite the fluctuation in consumer sentiment since the start of last year, overall personal spending was quite robust in 2016, with headline sales up 6.7% on average in volume terms, albeit lower than the 9.5% rise posted in 2015.”
Mr McQuaid said that even allowing for the weakness in sterling since last year’s Brexit referendum, which has enticed some shoppers to spend in Northern Ireland, retail sales in the Republic “have held up quite well”.
“Indeed, VAT receipts for the year to date are running ahead of official Department of Finance expectations,” he said.
“However, with the pound still very weak in relative terms, the worry for retailers is that more and more shoppers will head North between now and year-end, especially for the busy Christmas period.
“Still, personal spending growth is expected to be positive again in 2017, boosted by the continued fall in unemployment, but with the overall increase in headline sales likely to be lower than last year.
“Taking all the factors into account, we are now forecasting headline retail sales volume growth of around 3.5% in 2017.”
Article in the Irish Times
In the year to September, residential property prices at national level increased by 12.8%. This compares with an increase of 11.8% in the year to August and an increase of 8.0% in the twelve months to September 2016.
In Dublin, residential property prices increased by 12.2% in the year to September. Dublin house prices increased 12.4%. Apartments in Dublin increased 11.4% in the same period. The highest house price growth was in Dublin City, at 13.9%. In contrast, the lowest growth was in Dun Laoghaire-Rathdown, with house prices rising 9.9%.
Residential property prices in the Rest of Ireland (i.e. excluding Dublin) were 13.2% higher in the year to September. House prices in the Rest of Ireland increased 12.8% over the period. The West region showed the greatest price growth, with house prices increasing 16.5%. The Mid-West region showed the least price growth, with house prices increasing 9.8%. Apartment prices in the Rest of Ireland increased 15.5% in the same period.
Overall Decline
Overall, the national index is 23.7% lower than its highest level in 2007. Dublin residential property prices are 24.5% lower than their February 2007 peak, while residential property prices in the Rest of Ireland are 29.9% lower than their May 2007 peak.
Recovery
From the trough in early 2013, prices nationally have increased by 70.2%. In the same period, Dublin residential property prices have increased 87.0% whilst residential property prices in the Rest of Ireland are 61.4% higher.
CSO reports
Hambleden House
19-26 Pembroke Street Lower
Dublin 2
D02 WV96
Ireland
»Map
Phone: +353 (1) 6477900
Fax: +353 (1) 6477901
Email: info@bannon.ie
Title | Price | Status | Type | Area | Purpose | Bedrooms | Bathrooms |
---|